Merry Christmas

I wish you a Merry Christmas

Have a safe and happy holidays,
Srinivas Malyala

Unexpected query string(obiee url) behavior

I have observed one strange/unexpected behavior long back, thought of sharing with you guys.

To observe please login to any OBIEE Dashboard now go to browser URL, replace all characters after saw.dll? With ReloadDashboard (url looks like: http://yourobieeserverurl/analytics/saw.dll?ReloadDashboard) and click on go.

What you guys expect?

What I have expected here, dashboard page reloads.

What actually happening is, dashboard shows error message “errorInvalid item name () -- not allowed to be empty”.

Now logoff from Dashboard, go to browser URL replace all characters after saw.dll? With ReloadDashboard and click on go.

Here what you guys expect?

What I have expected here, nothing happens.

What actually happening is, page keeps on reloading for infinite times, sometimes browser could go into hangup state.

I thinking oracle obiee developers not handled this query string parameter ( ’saw.dll? ReloadDashboard’) properly or testers missed this one or I am confused! What do you guys say about it? Did they did with some purposely?

RSS option in OBIEE

With RSS feed we can see/track changes within catalog folder that appears on dashboard page by enabling RSS feed option.

To enable RSS feed option, follow these steps:

1) Go to Dashboard Objects (You can see dashboard objects when you create or edit dashboard pages)
2) Drag and Drop Folder object on to construction page.
3) Click on folder properties, Pops up with web panel.

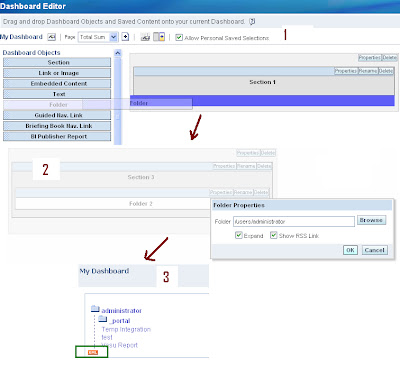
4) In above panel browse the folder which you want to display on Dashboard.
5) Check enable option ‘Show RSS Link'.
6) Click on save

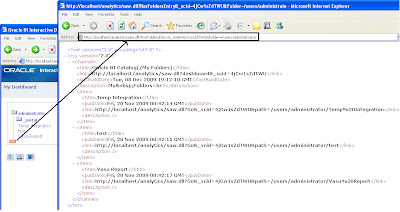
On Interactive dashboard page ‘xml’ icon should appears, which confirms RSS option enabled.

When we click on 'xml' link pops up with atom xml url(as shown below pic)..which we need to use this link to access RSS feed from any application.

How to see/track changes?

In the market there are so many RSS are available as online (NewsGator, Bloglines Beta,Google Reader,FeedShow, Rojo) and client applications .

Many BI dashboards are internal to organization’s network we cannot use any online RSS feed services like Google reader or FeedBurner etc; we need to go with client applications.

In this post I would like to introduce you two client applications which are very widely used by many people.

1) FeedReader

This tool is open source tool. Below pictures shows steps to configure and view rss feeds.

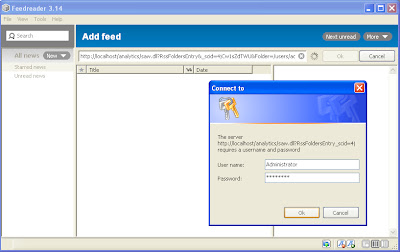
Above pic: Configuring the atom link within FeedReader and provide UserId/Password to authenticate.

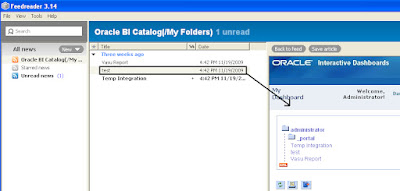
Above pic: First time when FeedReader fetches RSS.

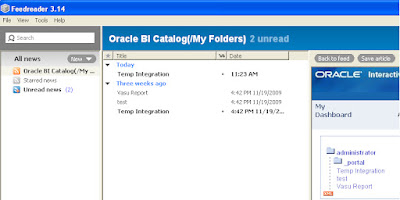
Above pic: After changes made to catalog folder, which were tracked by RSS in FeedReader(shown as Today).

2) RSS option in Outlook - Microsoft Office

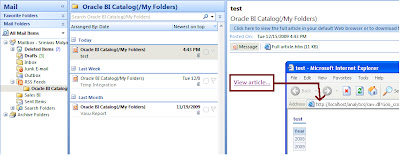
We can use outlook also as client application to track changes. Following pictures will show how to configure and access RSS feeds.

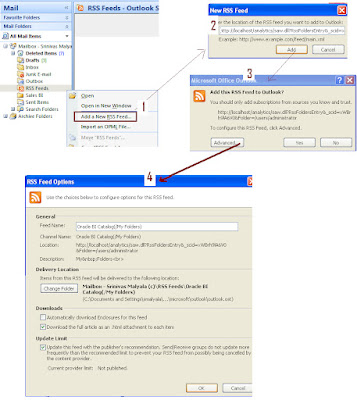
Above pic: Configuring RSS feed in Outlook

Above pic: Sample folder tracked by Outlook RSS.

Note: We need to enable RSS Feed Access through administration manage to see changes.To enable access need to give access as following.

Settings—Administration—Manage Privileges -- RSS Feeds—and give access to whom you want.

In our project we use to enable RSS on one of shared catalog folder to see any changes happened on shared folders reports as many users have access to shared folder. If some one changes, I use to validate changes to make sure every thing working fine and functionally it has meaningful.


For more information:

Adding an RSS Feed Option to a Dashboard Page’s Catalog Folder Page no 209

Introduction to RSS - Outlook - Microsoft Office

How to Get UserID and Password

On OTN this question asked. Question is how to get current UserID and Password on a Report, to address this here I'm posting this blog so that it will be help full to other people as well.
In Reporting we can get userid by using function 'USER()' but there is no flexibility on how to get password

To get password we need to do little trick as shown below.
Create new session initialization block with sql query as
select ':USER',':PASSWORD' from dual
And assign these values to session variables, example GetUser, GetPassword
access these session variables on report by VALUEOF(NQ_SESSION.GetUser) or VALUEOF(NQ_SESSION.GetPassword) respectively.


How to find current value of each Server Variables?

If you want to know current assigned values of server variables with in your BI Server then follow these steps.
1. Open RPD
2. Goto Manage menu tab
3. From manage menu select “Sessions …”
4. Pops up Session Manager
5. From available sessions choose a session
6. Now click on variables tab, it will show all server and session variables and respective values at that particular time.
In general following type of variables you can see here

Session System: all these variables have specific purpose (reserved key words) with in BI system
Exp: USER, DISPLAYNAME, EMAIL, LOGLEVEL, GROUP, LAST_SYNCH_TIME, PORTALPATH, REQUESTKEY, SKIN, WEBGROUPS, PASSWORD

Session Non-System: These variables are created by admin, for various reporting purposes.
Exp: USERROLE, USERGEO, USERCURRENCY etc

Session System and Session Non-System variables are specific to user logged on.

Dynamic Repository Variables:
These variables can be used by any users with in BI system created by admin,
Exp: LASTWEEK, LASTMONTH, YESTARDAY, CURRENTYEAR etc

Static Repository Variables:
These are initialized when BI Server start remain same as long as server runs.
Exp: PATH_TO_RESOURCE_FILES, WELCOME_MESSAGE, etc.

For more information on variables and how to create variables look at here

Best practice: Optimally define dynamic repository variables.


Quickly find out which presenation columns are used in which report

There is no easy way to find out which presentation columns are used in which reports and dashboards. I have come across a situation where we need to quickly identify presentation columns used in each report. I didn’t have enough time to go thru all reports.

To save time, I have created a tool which will output the below information.

Report path and name
Dashboard page name
Presentation column subject area name
All the Filters in the report
All the presentation column names (comma separated)

How to use this tool?

2 Launch cmd
3 In cmd pass parameters as following sequence database SID, Usage track schema user name, password.
Example:
C:\location_of_tool\ReportAnalysisConsoleApplication.exe oracle_database_SID usagetrack_USERID usagetrack_PWD > C:\output_directory_or_what_ever\AnalyzedDataOutput.txt

Prerequisites:
Report should access at least once after usage track enabled.

How to embed My Account link on dashboard page

One of question asked in BI Forum about how to move "My Accounts" link into "My Dashboard"
Here you can see half of solution i.e My Account embedding on to shared dashboard instead of My Dashboard.


To do that

Step 1: Go to C:\OracleBI\web\app folder
Step 2 Create a new file userPref.txt or what ever name you want.
Step 3 Place following code in this file userPref.txt then save the file.
< % @LANGUAGE="JScript" % >
< % Response.Redirect("saw.dll?UserPreferences"); % >(with out spaces between < % or % >)
Step 4 Rename the userPref.txt to userPref.asp (file extension type must be as .asp)
Step 5 Now Create a new dashboard page.
Step 6 Drag and drop Embedded Content object on this new page.
Step 7 Modify Embedded Content’s properties.
Step 8 In URL edit box place this url http://localhost/analytics/userPref.asp
Step 9 save the page.

Same way we can embed sessions, perfmon , Administration on Dashboard.

Leading or Trail Space Trim Issue

If you have column-values with leading or trail spaces those space will be trimmed by presentation services by default, if you drilldown to detail, will lead to no-results or wrong records.

Suppose in your column only these values are there ‘abc’, ‘abc ’ (spaced value),’xyz ’ (spaced value) if you drill on ‘abc’ you will get proper records of 'abc', if we drill on ‘ abc’ will display ‘abc’ records but not ‘ abc’ records, if we drill on ‘xyz ‘ then it will say no results.

To avoid these problems, change column’s data format property to “Plain text (don’t break spaces)” by this property presentation services will not trim leading or trail spaces.
Even in OTN once or twice asked this question, John and Stijn have suggested very good solutions.
I have faced same issue today, I cannot apply my logic because column selected from column selector, so went with Stijn's recommendation.

nQSError: 61013 Can not save changes to the repository

If you come across following error don’t be panic.
warning: can not save changes to the repository because,
[nQSError: 61013] File error: path= C:\OracleBI\server\Repository\paint.rpd , code=31: There has been a sharing violation.
May be its because of, you have started working on repository (offline mode) then started BI Server, after server services start, if you try to save repository you will see above message.

If you want to save all your changes just stop BI Services, and then save repository it will save all changes made to repository.

Obiee all Message Reference

Siebel Analytics Message Reference(click here to download) it’s a powerful tool for developer for debugging any problem occurred in obiee environment. It explains context of each message and suggests possible steps to overcome the problem.

Display Data Base Images on report

Inspired by one of post in OTN forum on how to populate data base images on a native report, here assumptions are database having image URL, images are residing in image resource folder.
To do that first keep all images files in OracleBI\web\app\res\s_oracle10\images i.e fmap:images\xyz.jpg
Keep all image file names (with file extn) in database as required.

Exp: Suppose geo dimension with
South as south.jpg
West as west.jpg
East as east.jpg,
North as north.jpg

To display images on report:

Add image’s column to report
(Just to illustrate example I have added image file names in ERROR_TEXT in Usage track Schema.)
Click on Column Properties, go to Data Format tab

Check “Override Default Data Format” and from drop down choose “Custom Text Format”
In Custom Text Format edit box place following script.
@[html]" < !-- img src="\\analytics\\res\\s_oracle10\\images\\""@H""" -- > "(Please uncomment html tags)

Browse report, images url's will be fetched from database appended with resource file displayed on report.

Here is a good example on how to embed image on a web page with various options.

Conditional Formatting in Grand Total in Pivot Table View


Just now saw a post in OTN on Conditional Formatting in Grand Total - Pivot Table View, here is a possible work around for this.

Sample Exp
Region price per unit
south 89
north 86
west 92
east 99
Grand total 91.5

Conditional format is if 90% above is green other wise red this works well on individual cells but not in default grand total option.
Possible solution is, create a report with required columns and apply required conditional formats on columns. Create pivot view, locate column choose more options, on click menu choose “new calculated item …” select function as AVG and select all available columns, give a name Grand Total or what ever may be say ok.
Now you can able to see conditional format on custom row "Grand Total Row".

Here are steps to do that(Paint Example)


Thinking on..., are there any other easy solutions :)

In Between Calendar Control with Sliding dates

I would like to share how I use to implement sliding days and dynamic date range with in reports.

Problem: Many times we come across requirement to have recent orders or activities etc. Here recent may be 1 day or 1 week or 1 month depends on different users.

Solution: To accommodate all above, I will pull report with latest 7 days i.e
Between CURRENT_DATE-7 and CURRENT_DATE and also I will give controls to user to choose between dates from page prompt so that user can get what they need.

Example: Today(July 24) report will pull recent 7 days as default(July 17 to July 24) and if I access same report tomorrow , report will pull July 18 to July 25 data as default. Same time user provided with page prompt control to choose dates. (Exp. July 17 to July 30).
Here are step by step to do that.
At first we need to have dynamic variables so create Server Variable’s for your requirement in my case startDate_ServerVariable with week ago date (SYSDATE - 7) and endDate_ServerVariable as Current date (SYSDATE).
1. To do that, in RPD navigate to repository – initialization block
2. Create new initialization block
3. Edit Data Source
4. Select Data Source Type as Database
5. Edit default initialization string with “select sysdate, sysdate-7 from dual”
6. Assign Connection Pool and also choose refresh rate of these variables.
7. Click on test to see proper values populated and say okay
8. Now click on Edit Data Target button
9. Create server variables
10. Click okay; close Variable Manager, Save RPD.


Now create prompts with Date-Calendar control and assign default value with server variable and also create new presentation variables as shown below.
Create report with filter on date column using between syntax will be like,
DateColumn is between @{startDate_PVariable}{1900-01-01 12:00:00} and @{endDate_PVariable}{1900-01-01 12:00:00}

For more detailed information follow these articles.
Venkat posted very good article on between, John has posted very good solution on Calendar Control.

Possible error:
If you have not specified proper default values for presenation variables exp "Date”.CreatedDate" is between @{startDate_PVariable} and @{endDate_PVariable} then you will end up with following error.
Error getting drill information: SELECT "Date”.CreatedDate" saw_0 FROM subjectarea WHERE "Date”.CreatedDate" BETWEEN date '0000-00-00' AND date '0000-00-00'
State: HY000. Code: 10058. [NQODBC] [SQL_STATE: HY000] [nQSError: 10058] A general error has occurred. [nQSError: 46048] Datetime Month value 0 from 0000-00-00 is out of range. (HY000)

Make sure proper default value has provided for presentation variable.

--Next post on how to manage/switch between multiple environments on single machine